Содержание
Beaming. Размеры динамиков и диаграмма направленности
Well… sort of. I'm going to offer some personal opinions that you might disagree with, but here it goes.
I like that you're doing the math and figuring out how high you should go with the midrange driver. (In this case, a 2.5« diameter driver) A 2.5» wavelength would equal about 5400Hz, however there's more to the story. I did some research a few years back and found that calculating for one wavelength doesn't give you the dispersion/ beaming that you think it does.
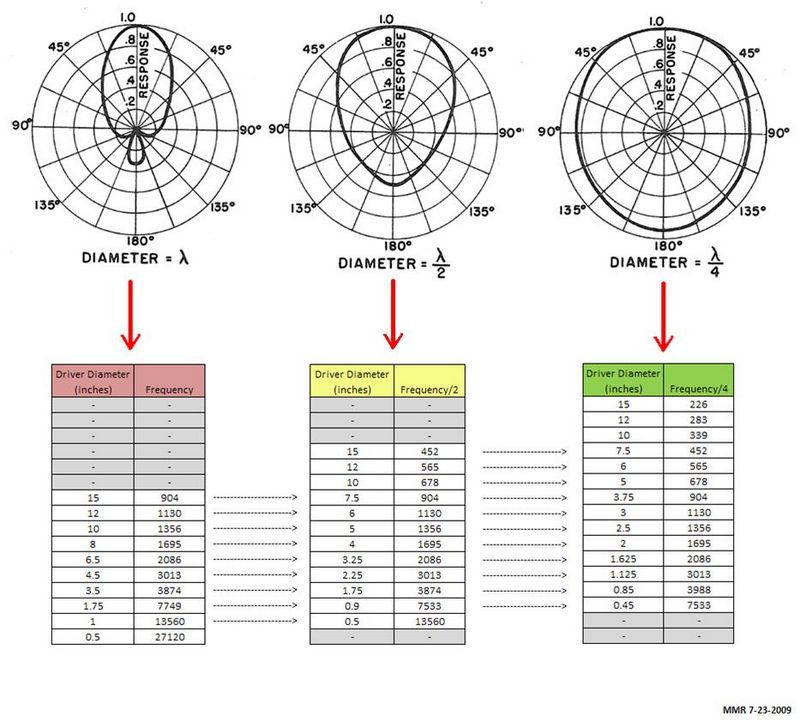
Take a peek at the chart I created. It was derived from research done waaaaay back.
It looks like a confusing mess at first. Start with the diagram on the left. This is what your calculations are producing. When the diameter of the driver approaches the wavelength that you're trying to produce, then you get the first diagram on the left. This dispersion pattern is not very good. Off axis response is far worse than you might have expected when you were doing your «beaming» calculations.
If you were to limit the 2.5« driver to the frequency associated with half of a wavelength instead of one wavelength, your dispersion would look more like the second figure. Ahhhhh, now that's better! (See the middle diagram.) This is what people are trying to show when they talk about beaming.
Taking this to the next logical step, look at how amazing the dispersion is if you limit the driver to one quarter of a wavelength. See the diagram on the right.
Reality kicks in… It's not quite practical to limit your 2.5» diameter midrange driver to an upper limit of 1356 Hz (see chart, green section), so some compromises need to be made. Having the midrange's upper limit be 1356 Hz would dictate having the tweeter ROLL ON at 1356 Hz, and that is rarely done for several reasons, most obvious is that you will burn the tweeter out fairly quickly.
So in general I try to use the green section (1/4 wavelength) of the chart whenever possible to get the best dispersion. That's fairly easy for low frequencies (woofers) but I usually end up with the yellow section (1/2 wavelength) for midrange drivers.
Let's get specific with your chosen drivers: In your case, a 2.5« midrange can produce the dispersion shown in the middle diagram if you limit it's upper freq to about 2700Hz. (By pushing the 2.5» mid up to 5400 Hz it would produce the dispersion shown in the left diagram…not good) Now, the good news is that most tweeter's can easily handle the power when rolled on at 2700Hz. So crossing the mid to tweeter any higher than 2700 Hz just makes your dispersion/ beaming worse.
Does this make any sense? You were on the right track with your math, but I would respectfully suggest modifying your calculations by a factor of 2 (or 4) to give better results. This can sometimes mean using a smaller diameter driver to get better dispersion. In your case, your 2.5« mid is among the smaller midrange drivers already… so that's a bonus.
Try re-running the calculations with a six-inch midrange. They're not so pretty… with an upper limit of 1130 Hz in order to obtain the yellow dispersion shown in the middle of the chart. How the heck are you going to roll-on a tweeter at 1130 Hz? So picking a smaller diameter like 2.5» allows you to push it's upper limit to 2700Hz. Perfect!
This just goes to show that everything in speaker design is tradeoffs. I prefer using small diameter drivers for the midrange frequencies and picking low crossover frequencies to obtain the best dispersion I can (as compared to 5 or 6« midrange drivers) As long as the drivers can handle the power and excursion limits associated with low crossover points, it should improve the dispersion and reduce beaming problems.
A quick 3-way example: An 8» woofer can easily play up to 200 Hz and still be in the green section of the chart. (great dispersion!)
Add to that → a 2.5« mid playing 200 Hz to 1700 Hz (almost in the green section… great dispersion!)
Add to that → a tweeter capable of playing 1700 Hz to 20 kHz and you've got a very wide dispersion design that minimizes beaming effects.
It's physics! Use this knowledge to your advantage to pick crossover frequencies that make sense and produce better results.
Speaker lobing calculator – Polar response
https://audiojudgement.com/speaker-lobing-polar-response/
MAY 15, 2017
When is speaker lobbing encountered?
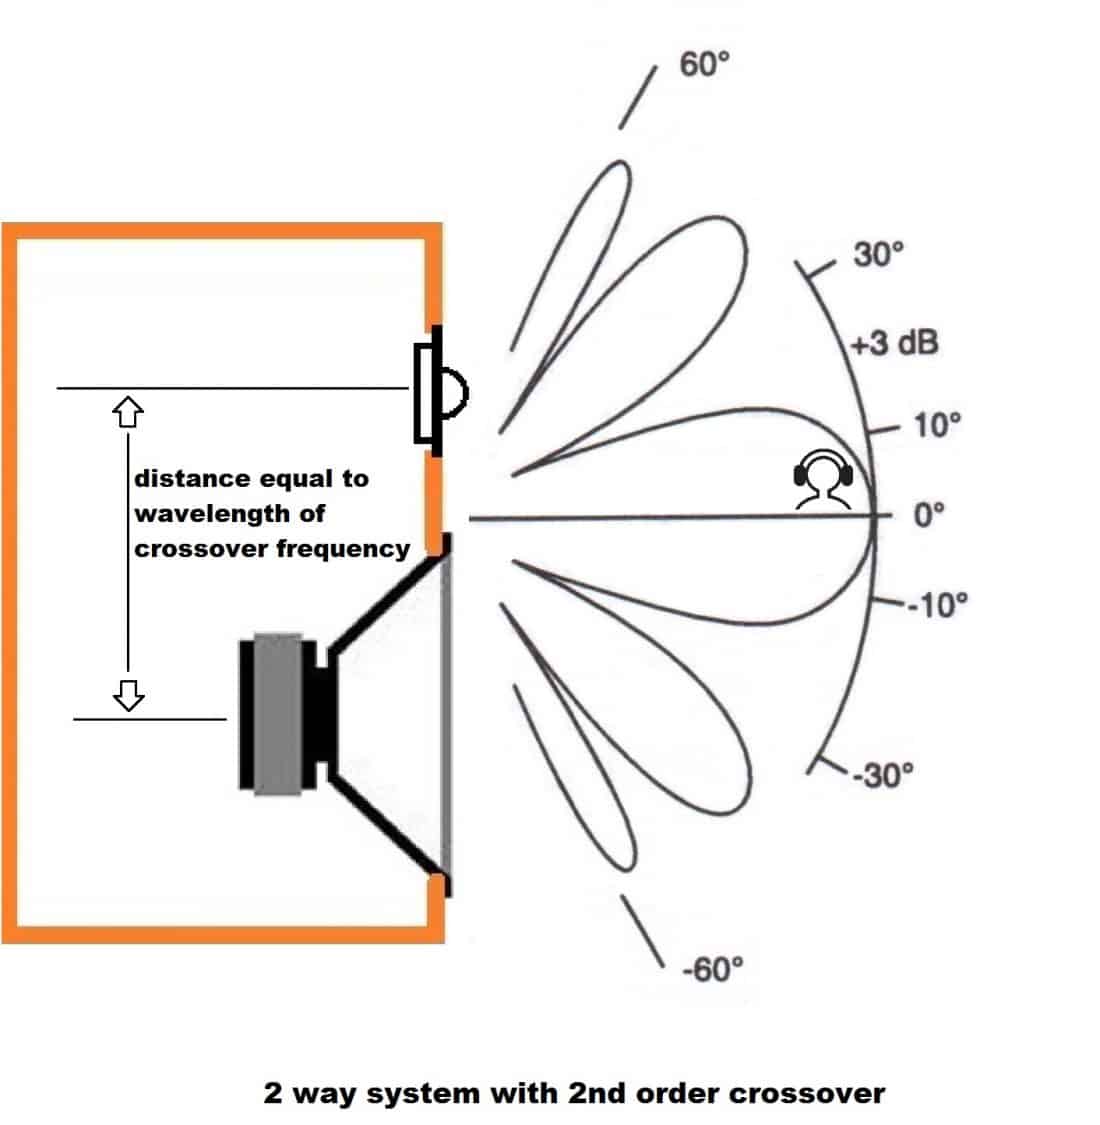
Speaker lobbing is a phenomenon which appears when there are 2 ore more speakers, that play the same frequency, and are of certain distance apart from each other. This is almost always the case in multi-way speakers. Let’s say, for example, you have a 2-way system with a mid-bass driver and a tweeter. These drivers will play the same frequencies at the crossover region. Also, they have some distance between them, because they are not coaxial drivers. Depending on the size of the drivers, the crossover frequency, and the distance between the drivers, speaker lobbing effects will happen to a certain degree. Let’s take it one step at a time, and it will be clear by the end.
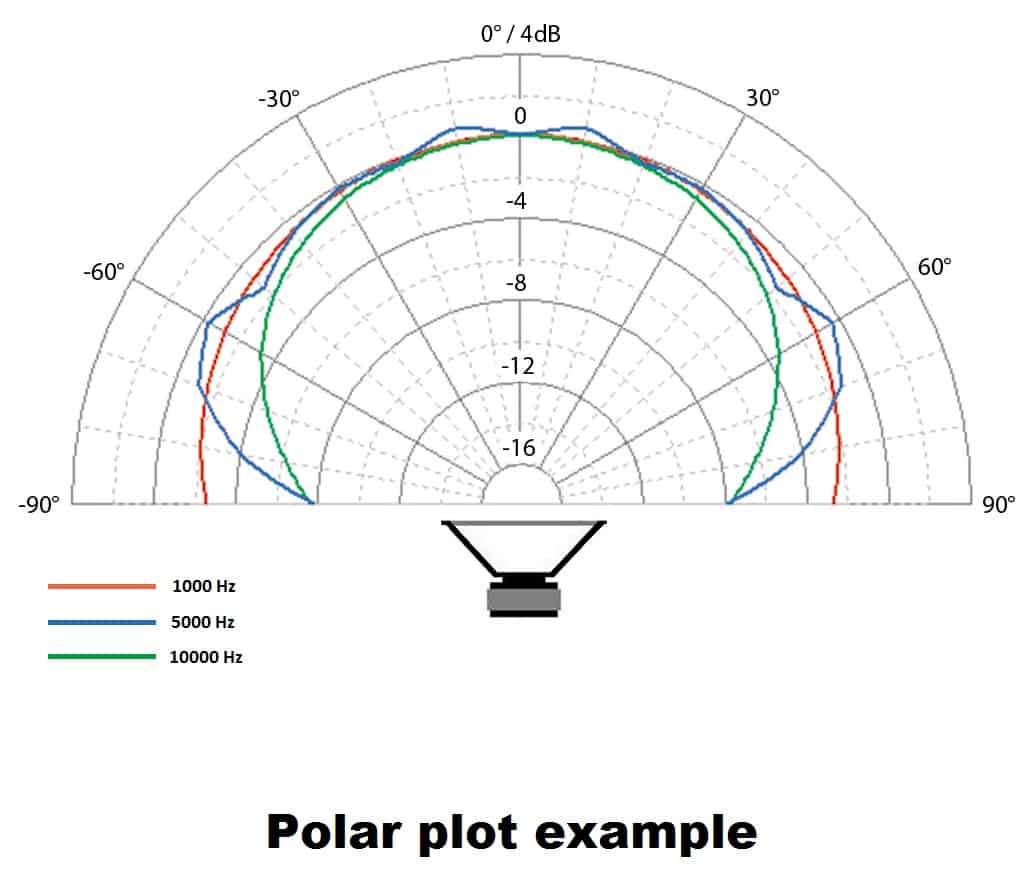
Polar response The polar response is a plot that reveals the speaker acoustic radiation into space. Here is a polar plot example :
polar plot
Explanation of the plot :
The speaker is considered to be placed in the center of the plot, firing sound outwards. You see a speaker in the diagram above, but it’s only present for visual reference. 0° marks the point of “on-axis”, or sitting directly in front of the speaker. 30°, 60° and 90° are off-axis points. If the response is closer to the center of the plot if means it’s lower in amplitude. You can see the decibel scale marked on the center of the plot. Points which are closer to the exterior, means they are louder. Different colors can be used for different frequencies. The plot above shows a horizontal polar response, and by the looks of it, has a fairly wide dispersion.
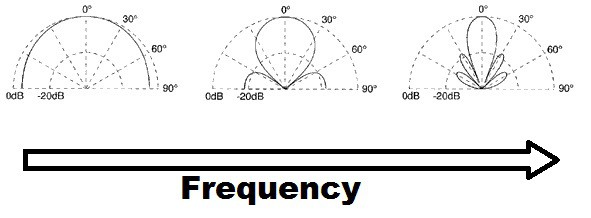
Speaker horizontal directivity When the speaker starts playing higher and higher frequencies, the horizontal acoustic dispersion starts to become more narrow.
Above we have a demonstration of what happens when frequency increases. On the left we have a nice wide dispersion. As we go up the frequency range (middle plot), the acoustic radiation starts to narrow down, or in other terms, it starts to “beam”. On the third plot, the beaming is even more pronounced as frequency increased even more. As a result, the on axis response is still very good, but if you switch your listening position a step to the right or to the left, you will have a severe drop in SPL at the particular frequency.
Beaming is in direct correlation with the size of the speaker. If the speaker is big it will start to beam sooner (as you go up in the frequency range), compared to speaker which has a smaller size. To calculate the frequency when the speaker will start to beam, use this formula :
f = (2 * c) / (π * D)
Where :
f = frequency where the speaker starts to beam (Hz). c = speed of sound (343 m/s). D = effective diameter of speaker (m). So let’s give and example for this Seas driver (Amazon affiliate paid link) : The effective diameter of the driver is 13.16 cm so 0.1316 m. In this case
f = (2 * 343) / (3.14 * 0.1316) = 1660 Hz
In conclusion, this driver will start to narrow its horizontal acoustic dispersion, starting with 1660 Hz. As the frequency will increase, the sound radiation will narrow even more. In conclusion, if you build a 2 way speaker system using this driver, consider this fact when choosing the crossover point. If, for example, the crossover frequency is 2500 Hz, know that the mid-bass driver will have less output in the 1600 Hz – 2500 Hz region. This is true only off-axis.
Speaker vertical directivity
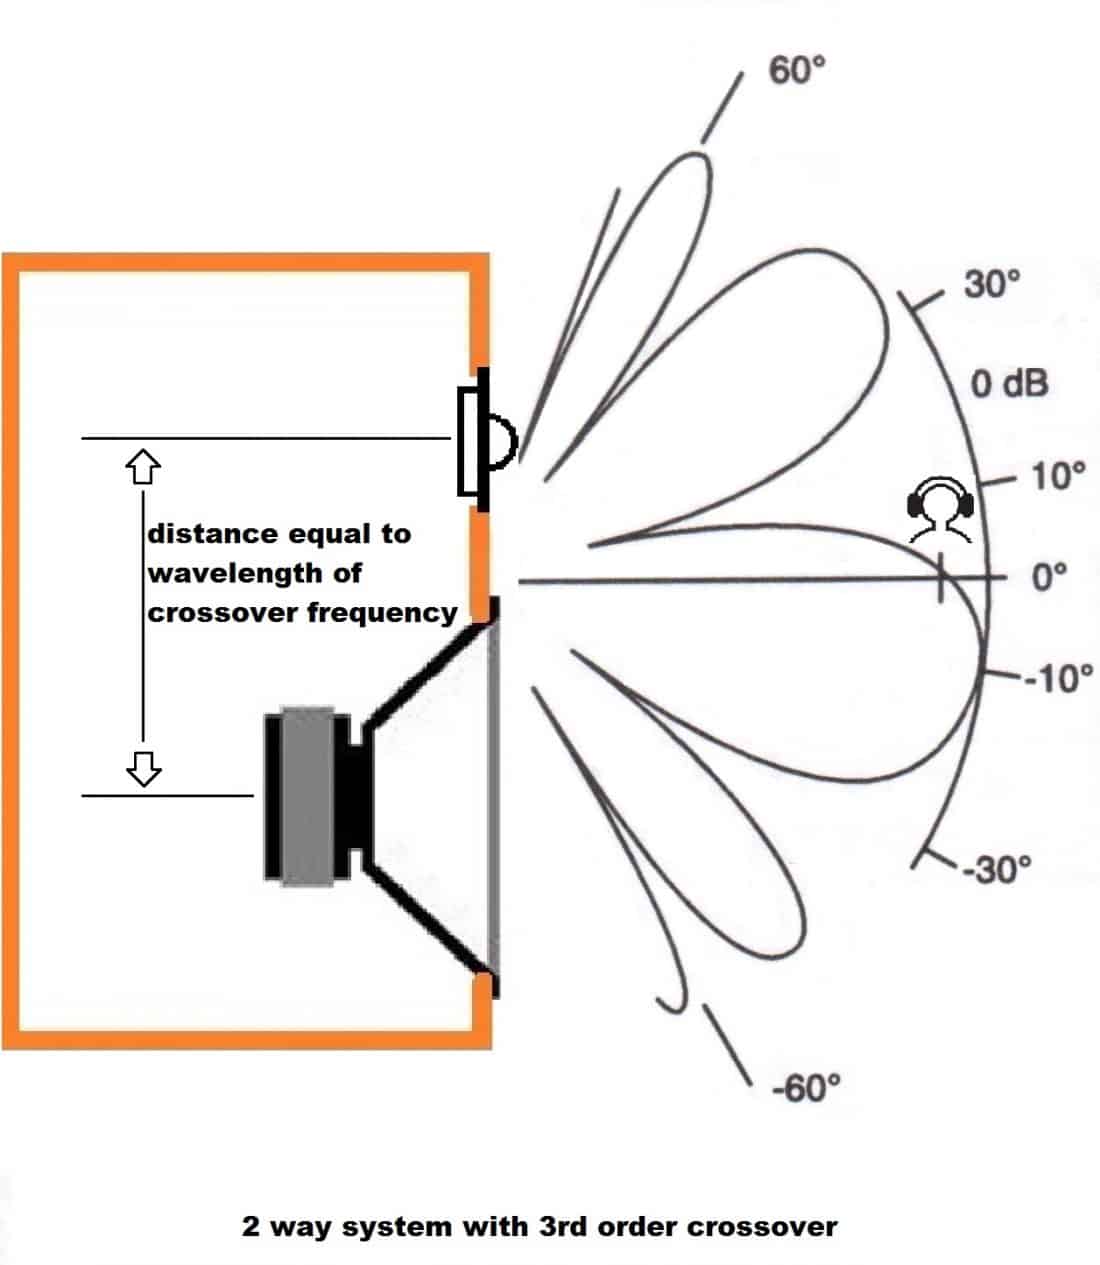
When discussing about vertical directivity, the type of crossover plays an important role. The type of crossover not only decides the sharpness of the roll-off, but also the acoustical radiation pattern. More about crossovers here.
speaker lobing 3rd order crossover
Above we have a vertical radiation pattern of a typical 2 way system with 3rd order crossover. The crossover frequency is 3000 Hz, so the distance between the 2 speaker centers is 11.4 cm (wavelength of 3 kHz). The listener is positioned on-axis. You can see the multiple lobes in the acoustical radiation pattern. That’s why the term speaker lobbing or acoustical lobbing. On the vertical axis there are positions of high sound pressure (mark by the lobes) and positions of low sound pressure (between the lobes).
The lobes become wider as frequency decreases. So, again, higher frequencies suffer more from this effect. In the scenario above, if the listener is sitting down (on-axis), and decides to stand up, he could experience lower sound intensity for the high frequencies (because of speaker lobbing).
speaker lobing 2nd order
In the example above we have the same speaker setup, but now with the a 2nd order crossover. The difference is that the 2nd order crossover has a radiation pattern which is symmetrical relative to the 0° axis. The acoustical radiation of the 3rd order crossover is slightly tilted.
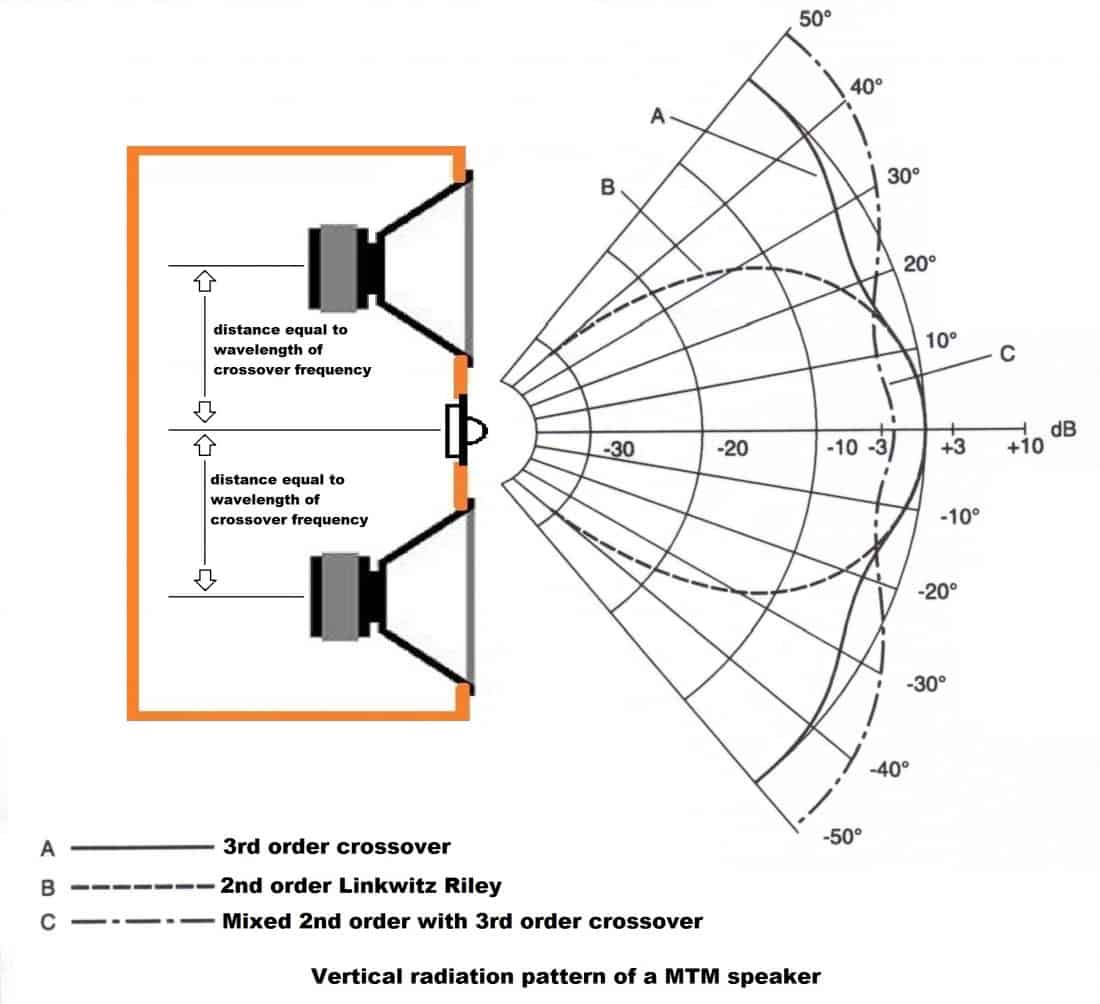
The MTM speaker One of the best solutions to minimize speaker lobing is to use an MTM speaker configuration ( mid-bass – tweeter – mid-bass).
MTM speaker
The MTM design needs the drivers to be spaced 1 wavelength of the crossover frequency apart, and use a 3rd order crossover topology. However, practice shows that the MTM speaker design produces a symmetrical acoustical radiation pattern no matter the type of crossover it’s using.
A – classic 3rd order crossover. B – 2nd order crossover produces a large symmetrical lobe. This type of radiation pattern is useful when you deliberately don’t want much off-axis response, hence less room reflections. C – Combines a 3rd order high pass filter for the tweeter with a 2nd order low pass filter for the mid-bass. Radiation patter similar to normal 3rd order crossover. The MTM speaker design is very popular specifically for its special acoustical radiation properties.
Conclusion When designing a speaker system, the off-axis response is quite relevant, and especially important for some. For this reason, choosing the right speaker size, how you position them and the crossover topology you pick, will dictate the speaker lobing characteristics. Keep this in mind if you are meticulous about your audio projects.
